
Imagine you hold a slice of pizza. Every hour, the chef adds more dough to the pie, but your slice stays the same size. Your percentage of the whole pie shrinks. This is emission rate in cryptocurrency. It’s not just about how many coins exist; it’s about how fast new ones hit the market and who gets them.
Most people look at price charts. Smart investors look at supply schedules. If a network prints tokens faster than demand grows, the price usually struggles. But if the network uses those new tokens to buy security or liquidity effectively, the dilution might be worth it. Understanding the emission rate helps you see past the hype and into the economic engine of a blockchain.
What Exactly Is Emission Rate?
Emission rate is the speed at which a protocol creates and releases new tokens into circulation. It acts as the monetary policy for a decentralized network. Unlike traditional banks that can tweak interest rates on a whim, most blockchains rely on code. That code dictates exactly when and how many new tokens appear.
You need to distinguish between gross issuance and net emission. Gross issuance counts every new token minted-block rewards, staking payouts, and liquidity mining. Net emission subtracts tokens that are permanently destroyed, like transaction fee burns. A network might issue 10% new tokens a year but burn 4%, resulting in a net inflation of 6%. Ignoring the burn makes you think the supply shock is worse than it actually is.
The formula seems simple: annual new tokens divided by current circulating supply. But the denominator matters. Are you measuring against circulating supply, total supply, or fully diluted supply? These numbers can differ wildly. A project might have low inflation now because only 10% of its max supply is live. As the rest unlocks, the effective pressure on price changes dramatically.
Why Emission Rates Matter for Investors
Dilution is the silent killer of returns. If you don’t stake or provide liquidity, you’re paying an implicit tax. The NBER working paper "The Tokenomics of Staking" describes this as an inflation tax on non-staked holdings. If the network issues 5% new tokens annually, and you hold cash-like stablecoins or unstaked assets, your relative ownership drops by that 5% unless the token price rises enough to offset it.
But high emission isn’t always bad. It depends on what the money buys. Bitcoin has near-zero inflation now, yet it spends billions on security via electricity costs paid by miners. Solana has higher inflation, but it uses those funds to pay validators directly, securing the network without relying solely on future appreciation. You have to ask: Is the protocol buying something valuable with these new tokens? Security? Storage capacity? Liquidity depth?
If a project pays huge emissions for low-quality liquidity that leaves when rewards drop, that’s waste. If it pays for validator uptime that prevents outages, that’s value. Evaluate the return on investment for the protocol itself, not just the holder.
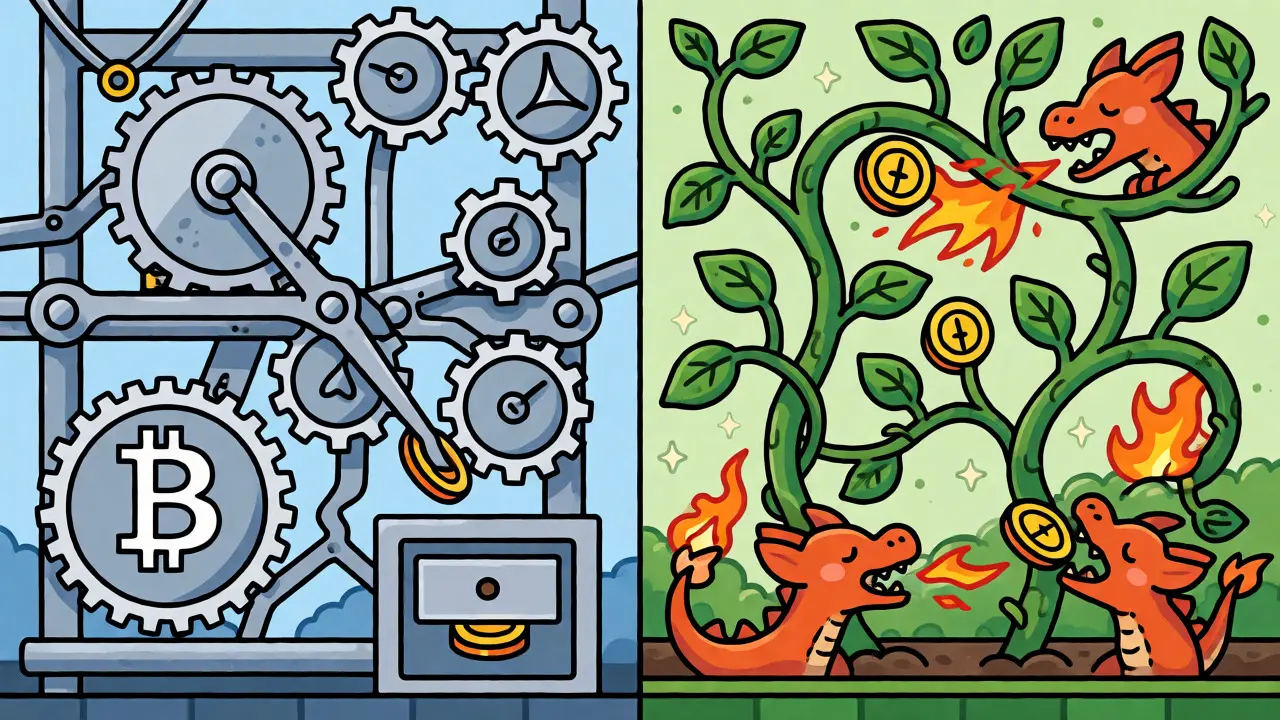
Major Control Mechanisms Compared
Protocols use different levers to control release rates. There is no single best model; each trades predictability for flexibility.
| Protocol | Mechanism | Key Feature | Risk Factor |
|---|---|---|---|
| Bitcoin | Halving Schedule | Fixed cap (21M), predictable cuts every 4 years | Security funding gap as subsidies vanish |
| Solana | Disinflation Curve | Starts at 8%, decays 15% yearly toward 1.5% | Governance can alter schedule; perpetual inflation |
| Ethereum | Issuance + Burn | Dynamic; deflationary during high activity | Unpredictable net supply based on usage |
| Polkadot | Governance Cap | Stepped reduction toward 2.1B DOT cap | Political complexity; potential for vote manipulation |
| Filecoin | Performance-Linked | Minting tied to storage growth metrics | Complex baseline calculations; hard to forecast |
Bitcoin: The Hard Cap Standard
Bitcoin remains the benchmark for predictability. Its subsidy halves every 210,000 blocks. In April 2024, the reward dropped from 6.25 BTC to 3.125 BTC. The next cut hits around 2028. This design forces scarcity. Miners currently earn from both new coins and fees. Eventually, fees must cover all security costs. If transaction volume doesn’t grow fast enough, miner revenue could squeeze, potentially leading to consolidation among large mining pools.
Solana: Predictable Decay
Solana avoids a hard cap but controls inflation through disinflation. It started at 8% annual inflation. Each year, the rate drops by 15% of its previous value. So, year two is roughly 6.8%, then lower, until it settles at a terminal rate of 1.5%. This ensures validators stay paid forever, unlike Bitcoin’s eventual zero-subsidy scenario. However, governance proposals like SIMD-0550 in 2026 show that communities can debate changing these parameters. Flexibility is a feature, but it introduces uncertainty.
Ethereum: Demand-Sensitive Supply
Ethereum mixes issuance with destruction. Validators get new ETH, but EIP-1559 burns base fees from transactions. During busy periods, burns exceed issuance, making ETH deflationary. During quiet times, it inflates. This aligns supply with network utility. High demand tightens supply automatically. The downside? You can’t know the long-term supply curve without predicting future usage. It’s dynamic, not static.
How to Analyze a Project’s Emission Health
Don’t just read the whitepaper’s marketing claims. Dig into the data. Here’s a practical checklist:
- Check the Unlock Calendar: Vesting cliffs for insiders often cause sudden supply spikes. A low inflation rate means nothing if 20% of the team’s tokens unlock next month.
- Calculate Net Issuance: Subtract burns from gross issuance. Look for consistent burn mechanisms, not one-off events.
- Assess Reward Distribution: Who gets the new tokens? If 90% go to early backers who sell immediately, price pressure is high. If they go to active users who lock them up, selling pressure is lower.
- Compare to Revenue: Does the protocol generate real yield (fees) that offsets dilution? If the network earns $10M in fees but emits $50M in value, holders are subsidizing the system.
For example, Curve Finance uses a piecewise-linear schedule where CRV inflation drops ~16% yearly. But allocation is political. veCRV voters decide which liquidity pools get rewards weekly. If voters ignore a pool, emissions there stop. This keeps capital efficient but requires active governance participation.

Pitfalls to Avoid
One common mistake is confusing "low supply" with "good tokenomics." A token with 1 billion max supply and 100 million circulating might seem less scarce than a coin with 10 million max supply. But if the latter has high insider concentration and low liquidity, it’s riskier. Focus on velocity and distribution, not just totals.
Another trap is ignoring the source of rewards. Some projects advertise "staking yields" that are just recycled emissions. If the yield comes from new tokens printed out of thin air, it’s not profit-it’s dilution disguised as income. Real yield comes from protocol fees, like trading commissions or lending interest.
Finally, beware of governance risks. Adaptive systems allow DAOs to change emission rates. While this prevents rigid failures, it opens the door to short-termism. Voters might approve higher emissions to fund marketing pushes, hurting long-term holders. Check if governance power is concentrated in a few whales.
Final Thoughts on Monetary Policy
Emission rate isn’t just a number; it’s the heartbeat of a token economy. It determines whether the network incentivizes behavior sustainably. Fixed schedules offer clarity but lack adaptability. Dynamic models respond to reality but add uncertainty. The best approach depends on the network’s goals. Bitcoin prioritizes digital gold status. Ethereum prioritizes utility alignment. Filecoin prioritizes resource matching.
As we move deeper into 2026, hybrid models are winning. Pure fixed supply is rare outside Bitcoin. Most successful chains blend issuance with burns, vesting, and performance incentives. When evaluating a new project, ask: What function does the emission serve? Is it buying security, liquidity, or attention? And crucially, is that purchase creating value greater than the cost of dilution?
Does a high emission rate always mean the price will drop?
Not necessarily. High emission increases supply, which can pressure price, but only if demand doesn't keep pace. If the new tokens are used to attract users, secure the network, or provide liquidity that drives more activity, the increased demand can absorb the extra supply. For example, early-stage protocols often need high emissions to bootstrap adoption.
What is the difference between gross and net emission?
Gross emission is the total number of new tokens created by the protocol. Net emission is gross emission minus any tokens permanently removed from circulation, such as through transaction fee burns or buybacks. Net emission gives a more accurate picture of actual supply inflation affecting holders.
How does Bitcoin's halving affect its emission rate?
Bitcoin's halving reduces the block subsidy by 50% approximately every four years. This sharply decreases the rate at which new BTC enters circulation. Since the subsidy is the primary source of new supply, halvings significantly lower the annual inflation rate, enhancing scarcity over time.
Can governance change a token's emission schedule?
Yes, in networks with flexible monetary policies like Solana or Polkadot, token holders can vote to adjust emission parameters. This allows adaptation to market conditions but introduces political risk, as decisions may favor short-term incentives over long-term stability.
Why is the denominator important in calculating emission rate?
The denominator determines the base against which new supply is measured. Using circulating supply shows immediate dilution effects, while using fully diluted supply reflects maximum potential expansion. Misinterpreting the denominator can lead to underestimating or overestimating the true inflationary pressure on token holders.